计时和数据记录
用于计时和数据记录的常用工具。
wait(time)
将用户程序暂停指定的时间。
| 参数: | time(时间:ms) – 等待多长时间。 |
class StopWatch
用于测量时间间隔的秒表。类似于手机上的秒表功能。
time()
获取秒表的当前时间。
| 返回: | 经过的时间。 |
| 返回类型: | 毫秒 |
pause()
暂停秒表。
resume()
恢复秒表。
reset()
将秒表时间重置为 0。
运行状态不受影响:
- 如果它已暂停,则保持暂停状态(但现在为 0)。
- 如果它正在运行,它会保持运行(但从 0 重新开始)。
class DataLog(*headers, name='log', timestamp=True, extension='csv', append=False)
创建文件并记录数据。
| 参数: |
|
log(*values)
将一个或多个值保存在文件的新行上。
| 参数: | values (object, object, ...) – 一个或多个对象或值。 |
默认情况下,此类在 EV3 砖块上创建一个 csv 文件, 其中包含名称日志以及当前日期和时间。例如,如果您在 2020 年 2 月 13 日 10:07 和 44.431260 秒使用此类,则该文件将调用 log_2020_02_13_10_07_44_431260.csv 。
请参阅管理 EV3 上的文件 ,了解如何将日志文件上传回计算机。
示例1:记录和可视化测量结果
此示例演示如何记录旋转轮随时间推移的角度。
#!/usr/bin/env pybricks-micropython
from pybricks.ev3devices import Motor
from pybricks.parameters import Port
from pybricks.tools import DataLog, StopWatch, wait

# Create a data log file in the project folder on the EV3 Brick.
# * By default, the file name contains the current date and time, for example:
#   log_2020_02_13_10_07_44_431260.csv
# * You can optionally specify the titles of your data columns. For example,
#   if you want to record the motor angles at a given time, you could do:
data = DataLog('time', 'angle')

# Initialize a motor and make it move
wheel = Motor(Port.B)
wheel.run(500)

# Start a stopwatch to measure elapsed time
watch = StopWatch()

# Log the time and the motor angle 10 times
for i in range(10):
    # Read angle and time
    angle = wheel.angle()
    time = watch.time()

    # Each time you use the log() method, a new line with data is added to
    # the file. You can add as many values as you like.
    # In this example, we save the current time and motor angle:
    data.log(time, angle)

    # Wait some time so the motor can move a bit
    wait(100)

# You can now upload your file to your computer
在本例中,生成的文件包含以下内容:
time, angle
3, 0
108, 6
212, 30
316, 71
419, 124
523, 176
628, 228
734, 281
838, 333
942, 385
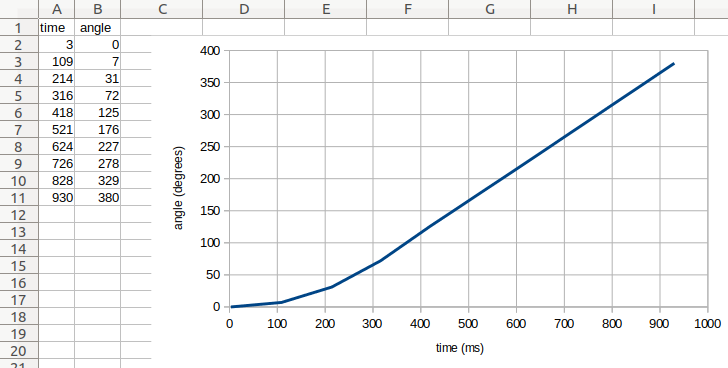
如上所示将文件上传到计算机后,您可以在电子表格编辑器中打开它。然后,您可以生成数据图,如图 18 所示。
在这个例子中,我们看到电机角度一开始变化缓慢。然后角度开始变化得更快,图表变成一条直线。这意味着电机已达到恒定速度。您可以验证角度是否每秒增加 500 度。

图 18 原始文件内容(左)和生成的图形(右)。
示例:使用可选参数
此示例演示如何记录数字以外的数据。它还演示了如何使用 DataLog 类的可选参数来选择文件名和扩展名。
在此示例中,timestamp=False,这意味着日期和时间 不会添加到文件名中。这很方便,因为文件 名称将始终相同。然而,这意味着 每次运行此脚本时,my_file.txt 都会被覆盖。
#!/usr/bin/env pybricks-micropython
from pybricks.parameters import Color
from pybricks.tools import DataLog

# Create a data log file called my_file.txt
data = DataLog('time', 'angle', name='my_file', timestamp=False, extension='txt')

# The log method uses the print() method to add a line of text.
# So, you can do much more than saving numbers. For example:
data.log('Temperature', 25)
data.log('Sunday', 'Monday', 'Tuesday')
data.log({'Kiwi': Color.GREEN}, {'Banana': Color.YELLOW})

# You can upload the file to your computer, but you can also print the data:
print(data) EV3机器人

