- Introduction(介绍)
- Sensor(传感器)
- Motor(电机)
- Remote(远程)
- Display(显示)
- Oscilloscope(示波器)
- Sound(声音)
- Statistics(统计)
- Timer(定时器)
- Drawing robot(绘图机器人)
- Morse code(摩斯电码)
- Robot Arm(机械臂)
- Gyro Boy(陀螺男孩)
- Annex(附件)
Oscilloscope 示波器
The EV3 has a 178 × 128 pixel Monochrome display. The corners have these coordinates:
EV3 具有 178 × 128 像素的单色显示屏。角具有以下坐标:
- top-left - (1, 1) 左上角 - (1, 1)
- bottom-left - (1, 128) 左下角 - (1, 128)
- top-right - (178, 1) 右上角 - (178, 1)
- buttom-right - (178, 128)
右臀部 - (178, 128)
It can display: 它可以显示:
- 12.8 lines of small text
12.8 行小文本 - 22 characters long 长度为 22 个字符
The small character occupy 10x8 pixels. One character is
小字符占用 10x8 像素。一个字符是
- 9 pixels high 9 像素高
- 7 pixels wide 7 像素宽
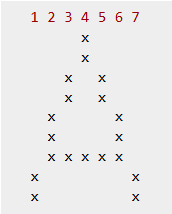
For exemple an A is composed of these pixels:
例如,A 由以下像素组成:
Characters used 使用的字符
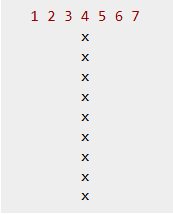
For the oscilloscope we are going to use the vertical bar:
对于示波器,我们将使用竖线 :
the horizontal bar (underscore):
水平条 (下划线):
Display a horizontal line
显示水平线
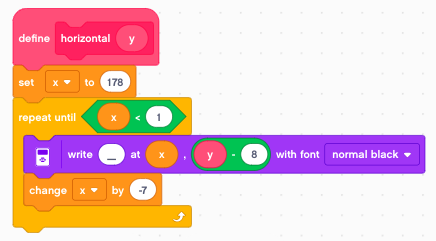
With this information we are ready to display a horizontal line at position y. We define the variables x and y.
有了这些信息,我们就可以在位置 y 显示一条水平线了。我们定义变量 x 和 y。
We write backwards. The reason for this is that the 7x9 pixel character is printed on a 8x10 pixel field. In fact the left and the top 1-pixel-wide line is erased.
我们倒着写。这样做的原因是 7x9 像素字符打印在 8x10 像素字段上。实际上,左侧和顶部 1 像素宽的线条已被擦除。
So we initialize x to 178, and decrement by the caracter width of 7. With regards to y there is a -8 pixel offset.
所以我们将 x 初始化为 178,并递减 caracter 宽度 7。对于 y,有一个 -8 像素偏移。
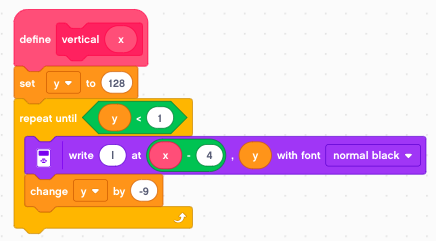
Display a vertical line 显示一条垂直线
Then we define the vertical(x) function.
然后我们定义 vertical(x) 函数。
So we initialize y to 128, and decrement by the caracter height of 9. With regards to x there is a -4 pixel offset.
因此,我们将 y 初始化为 128,并递减 caracter 高度 9。对于 x,有一个 -4 像素偏移。
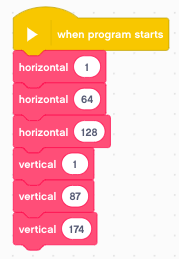
Display a grid 显示网格
Finally we can draw a grid.
最后,我们可以画一个网格。
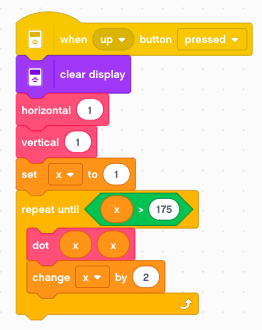
Draw a dot 画一个点
The function write text at (x, y) can place a character at the position (x, y). To draw an arbitrary curve using dots, we could use the dot (.) or the hyphen (-).
函数 write text at (x, y) 可以在位置 (x, y) 放置字符。要使用点绘制任意曲线,我们可以使用点 (.) 或连字符 (-)。
But the best way is to use an underscore (_) followed by a space character. The space character is offset by 2 pixels and erases the 6 unused pixels of the underscore. This allows us to draw a dot every 2nd pixel.
但最好的方法是使用下划线 (_) 后跟空格字符。空格字符偏移 2 个像素,并擦除下划线的 6 个未使用的像素。这允许我们每 2 个像素绘制一个点。

The example below draws a diagonal line starting at (1, 1).
下面的示例绘制了一条从 (1, 1) 开始的对角线。
Display a scope trace 显示范围跟踪
Now we have all the elements to program an oscilloscope. We start at x=1 and loop until x>175. At each iteration we increase x by 2.
现在我们有了对示波器进行编程的所有元素。我们从 x=1 开始,循环直到 x>175。在每次迭代中,我们将 x 增加 2。
The y value is the angular gyro velocity. We display it numerically on line 1. And we plot it with an offset of 64 to the screen.
y 值是陀螺仪角度速度。我们在第 1 行以数字形式显示它。我们用 64 的偏移量来绘制它到屏幕。
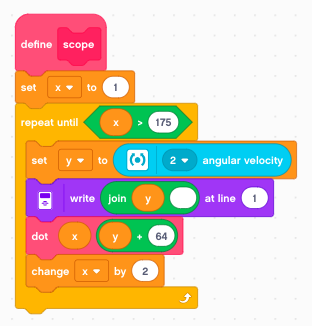
With a button press we can acquire a single trace of 88 samples.
只需按一下按钮,我们就可以采集 88 个样本的单迹。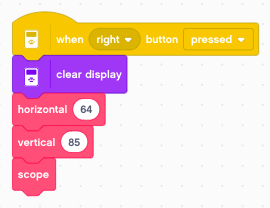
Measure continously 连续测量
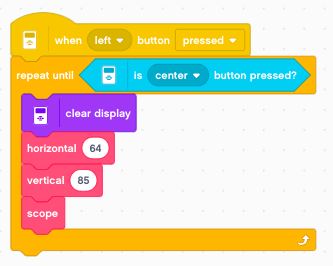
We can place it inside a loop and measure continously.
我们可以将其放在一个循环中并连续测量。
You can download the programs so far: scope.lmsp
到目前为止,您可以下载这些程序: 范围.lmsp
 图形化编程
图形化编程